There is No Escaping the Fact that there is a Climate Crisis
Here is a Simple Explanation of the Evidence
Visit the Evidence Files Facebook and YouTube pages; Like, Follow, Subscribe or Share!
There are two undisputable facts about climate change: 1) it is happening, and 2) humans are causing it. The evidence is so abundant, that any refutation of either of those statements is simply dogmatic belief. And belief won’t prevent the real-world consequences. Many people fall victim to their inability to consume an admittedly vast canon of evidence to simply dismiss it all, sometimes out of their own “knowingness,” other times by clinging to the belief that it is simply too expensive or impossible to fix. To help those who want to understand, this article breaks down numerous pieces of the evidence behind climate change.
Heat
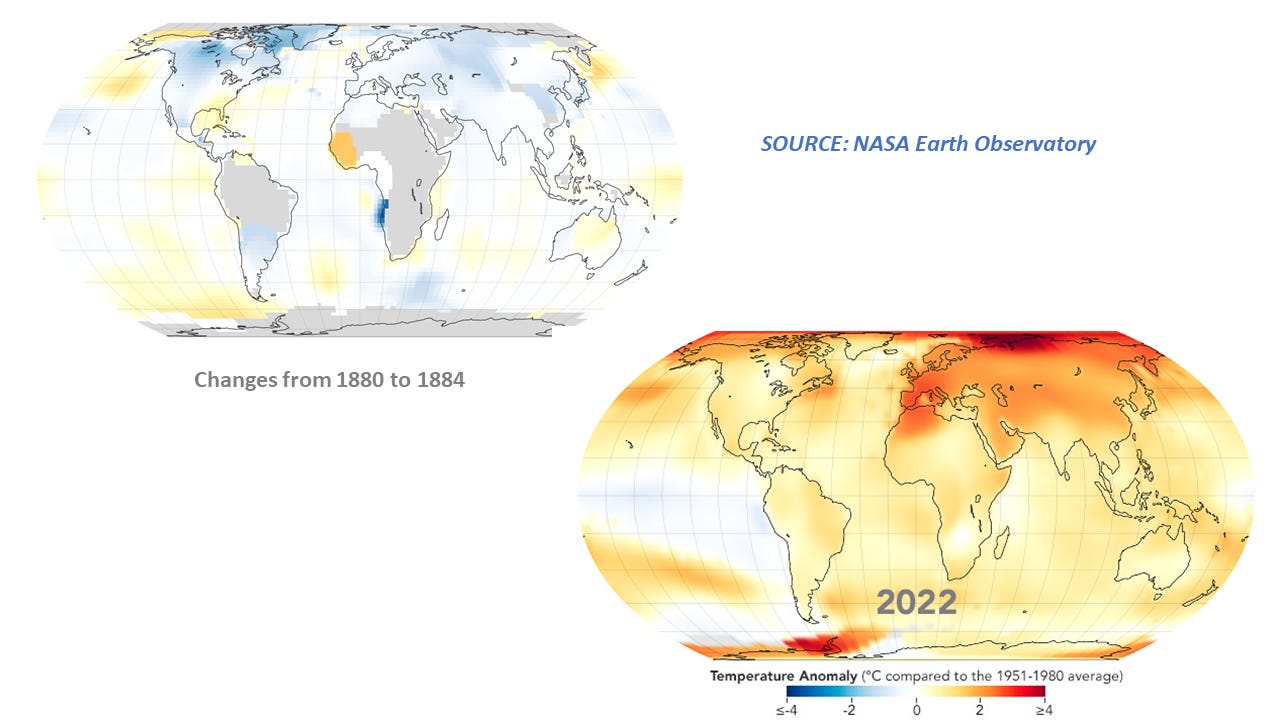
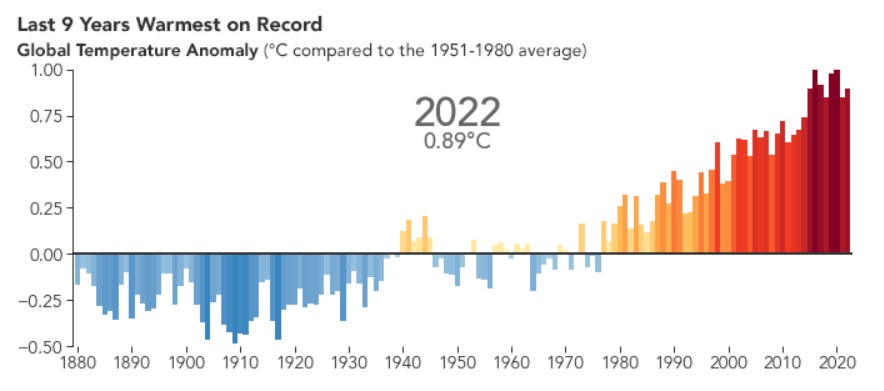
The world is warming—and fast. Since about 1880, the average global temperature on Earth has risen by at least 1.1° Celsius (1.9° Fahrenheit), with the majority of that occurring since 1975. Global average temperature means that in some places it rises substantially more, and less so in others.
The nine warmest years on record have occurred since 2010. Between 2000 and 2020, 19 of those years were the warmest ever recorded. The four warmest days ever recorded occurred in the days leading up to this publication, with the global average temperature reaching 17.18 degrees Celsius, or 62.92 degrees Fahrenheit.
Source: NASA
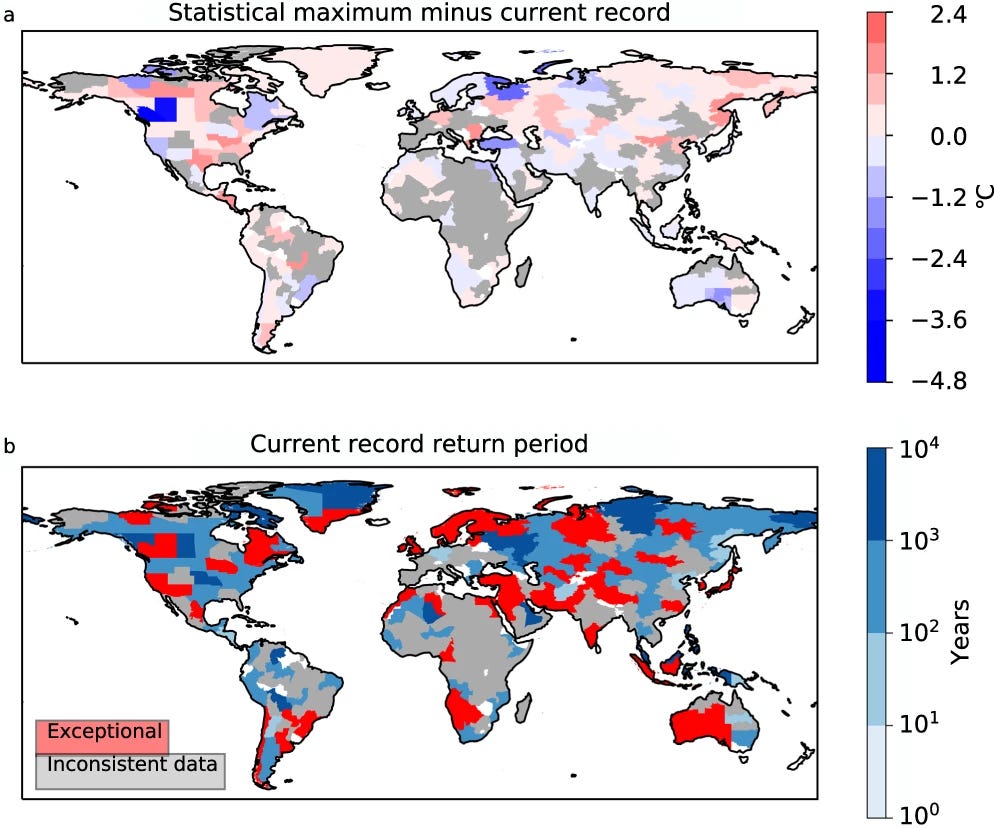
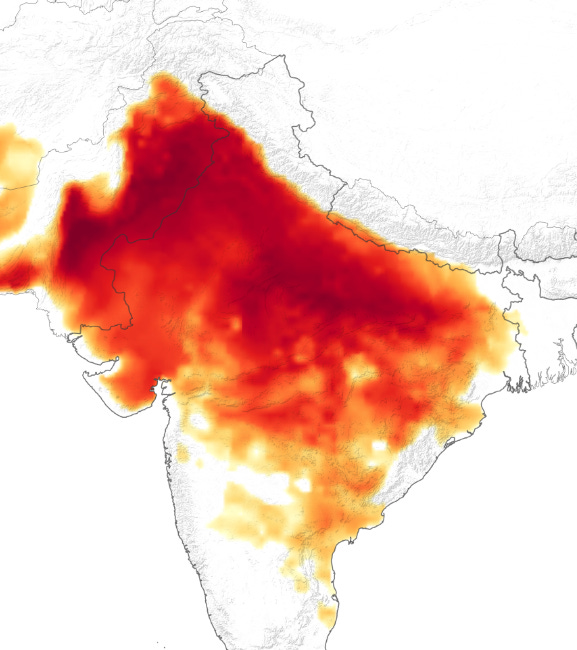
Unequally disbursed temperature growth is profoundly affecting some parts of the world. Scientists have found that shifting climates have increased the odds of lethal heatwaves in south Asia by 30 times. In March 2023, India recorded its hottest month in 122 years of record-keeping while Pakistan showed the highest worldwide anomaly in temperature. Temperatures in some places reached 50°C (122°F). Life in these regions may soon become untenable for humans. Between 2000 and 2020, the risk of death from heat related illnesses increased globally by 5 to 10%. The largest regional increase of heat-related deaths in those years occurred in Asia, primarily south Asia. Other areas are not exempt. In 2021, an effect called a “heat dome” caused the deaths of hundreds of people in the Pacific Northwest, and killed billions of sea creatures in the area. One study showed the statistical aberration of heat waves in numerous places. The first image shows risk areas for extreme temperature deviation following a 10,000-year pattern, the second shows deviation rates from 1959-2021.
Source: World Economic Forum
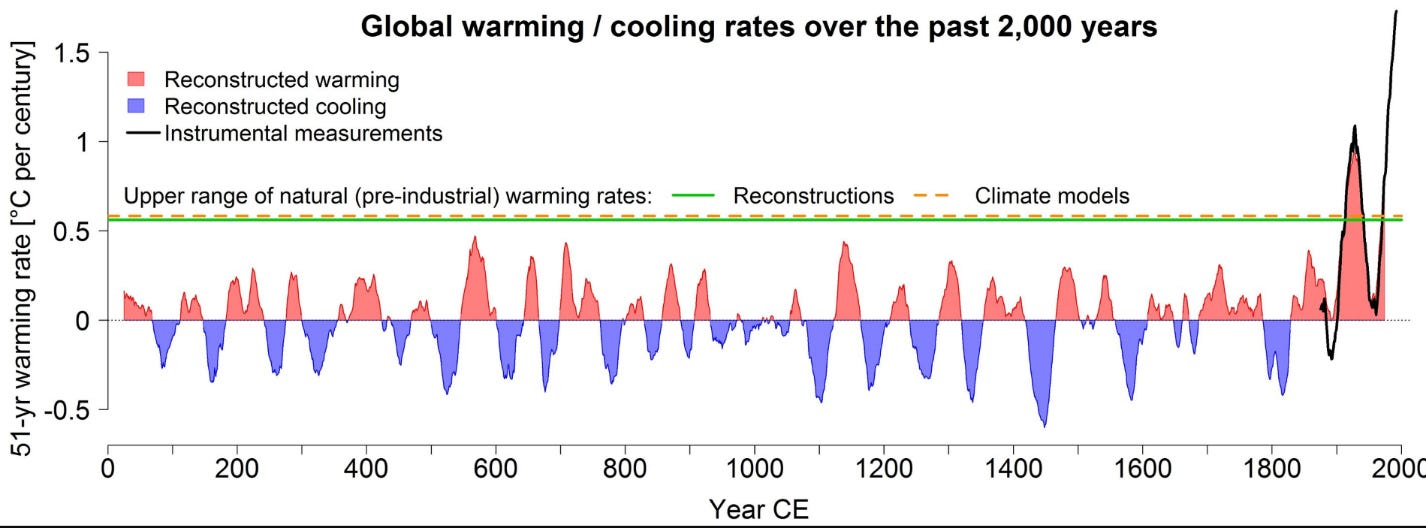
The extreme heat patterns in the second image do not align with any “normal” trend throughout all of human history. While climate does change over long periods of time, previous changes were sufficiently slow to allow people to go through the necessary adaptations. In the event of substantial acute disruptions to climate stability, numerous major civilizations collapsed as a result, including the Cambodians, Mayans, Norse, and Egyptians, to name a few. Those were from regional destabilizations; today’s problem is a global one. The 1990s was the warmest decade in at least a thousand years. All of the 21st century has been hotter still. If the current warming trend of the last 150 years continues, Earth will have witnessed warming at a rate 45 times faster than the warming that occurred at the end of the last ice age.
Source: University of Bern
How do we know how hot it was centuries or millennia before? Scientists employ many methods. Some are more complex than others, so click on any of the linked text for further detail. One method is to examine the traits of fossilized plants. Specific features of fossilized plants indicate the relative temperature the plant endured during its lifetime. Dropstones also provide clues about the environment at the time of their creation or deposit. In particular, they offer generalized information about whether the surrounding climate was especially hot or cold. Snowflakes trap atmospheric gases when they fall. In some places, these gas bubbles are preserved as snow is tightly packed and then frozen. Analysis of the gases allows scientists to determine the contemporary temperature based on the composition of the gases. These samples are extracted from what scientists call ice cores.
Scientists also examine the oxygen isotopes present in fossilized marine organisms. The ratio of the isotopes provides strong indicators of the surrounding environment because the isotope construction is directly affected by temperature. When these creatures die, the oxygen isotope ratio becomes fixed, preserving conditions at that moment in time. Banding in fossilized coral and lake sediment also show the temperature at the time of forming. Scientists determine the temperature by examining the chemistry in these bands. Tree rings’ shape and size provide clues about the temperature at the time of their forming as well. Researchers study fossilized pollen to reveal what plants proliferated and when, which tells scientists a great deal about the climate at various time periods and places. Chemicals stored in marine sediment cores provide climate information similarly to how scientists acquire information from oxygen isotopes. All this data (and more) can be collected and fed into climate models to create highly accurate assessments covering long periods of time.
Ice
Unfortunately, the areas seeing the swiftest increase in temperatures contain a critical resource: fresh water in the form of snow and glaciers (ice). The Himalayan Mountains provide an enormous amount of sustenance to billions of people the world over. This includes food, hydroelectric power, fresh water, and more. Only the polar regions contain more freshwater than the Himalayas. Between 1970 and 2000, 9% of the ice in the Himalayas disappeared. Contemporary loss of glacier mass in eastern Nepal and Bhutan has accelerated ten-fold compared to any long-term assessment of previous fluctuations, going back as far as the Little Ice Age. Current trends indicate that the Himalayan glacial total could reduce by 80% by the end of the century—and that is if climatic conditions do not significantly worsen before then. Glacial loss leads to declining snow cover, which provides the bulk of the freshwater to lower-lying areas. More than 1.9 billion people rely on the water flowing from the Himalayas. The impact of severe reductions of drinking water to this region will inevitably lead to economic disaster, violent conflict, or even mass migration. Melting glaciers also elevate the risk of other disasters such as avalanches, landslides, and floods.
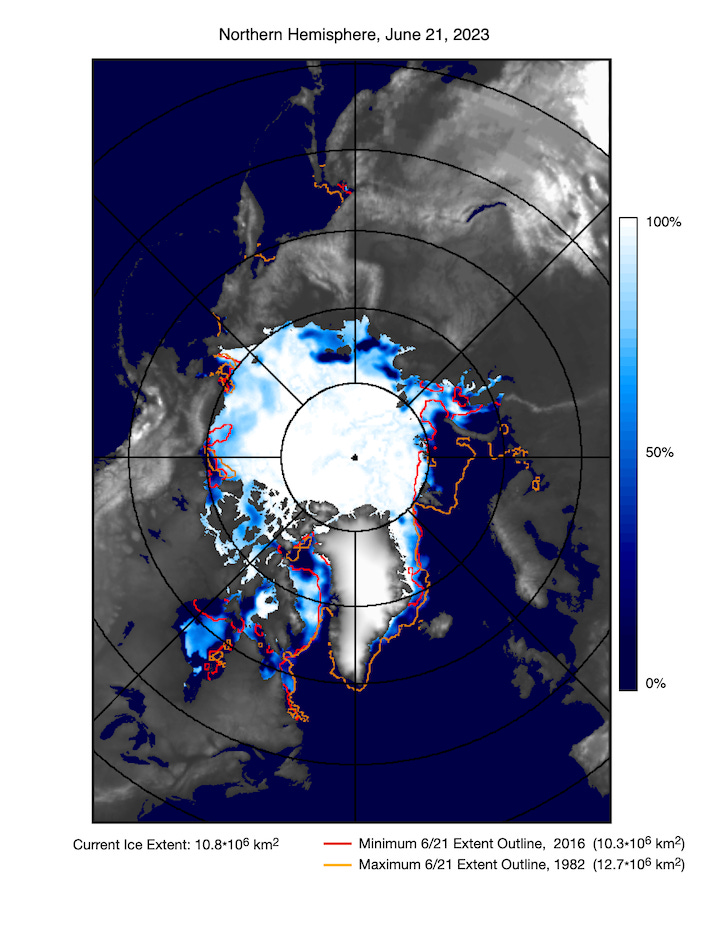
Like the Himalayan glaciers, polar ice has been declining at an alarming rate. Since the 1990s, the ice caps have been melting 6x times faster than previously, when the ice sheet existed near a state of balance. Between 1992 and 2019, for example, the Greenland ice sheet lost around 3,900 billion tons of ice, which contributed to a rise of nearly 10 mm of sea level. The Antarctic ice sheet is losing ice cover at nearly the same rate. This may sound like a small amount of sea level change, but like a single degree of global temperature change, the impacts are not felt uniformly worldwide. Andrew Shepherd, from the University of Leeds, described sea level change this way: “Every centimeter of sea level rise leads to coastal flooding and coastal erosion, disrupting people’s lives around the planet.” The current rate of ice cap melting signifies an increased risk of exposure from 360 million to 400 million people per year. The Antarctic and Greenland ice sheet melt is contributing to only about 1/3 of the total sea level change. Warming ocean water (discussed below) and other, smaller glacier melts also affect sea level. As glaciers melt, they cause a destabilization of the overall system, which leads to swifter melting even under the same atmospheric conditions. Worse still, the rate of melt and subsequent sea level change is directly in line with predictions made decades ago by the Intergovernmental Panel on Climate Change (IPCC)—which were not rosy projections. Over the past 30 years, the oldest and thickest portions of the polar ice caps have diminished by 95%. Some estimates expect a 100% loss of summer Arctic sea ice by 2040, but more likely even earlier. Professor Dirk Notz, of the University of Hamburg, Germany, who studies Arctic sea ice coverage stated, “Unfortunately it has become too late to save Arctic summer sea ice… This is now the first major component of the Earth system that we are going to lose because of global warming. People didn’t listen to our warnings.”
Source: NASA Goddard Earth Sciences Division
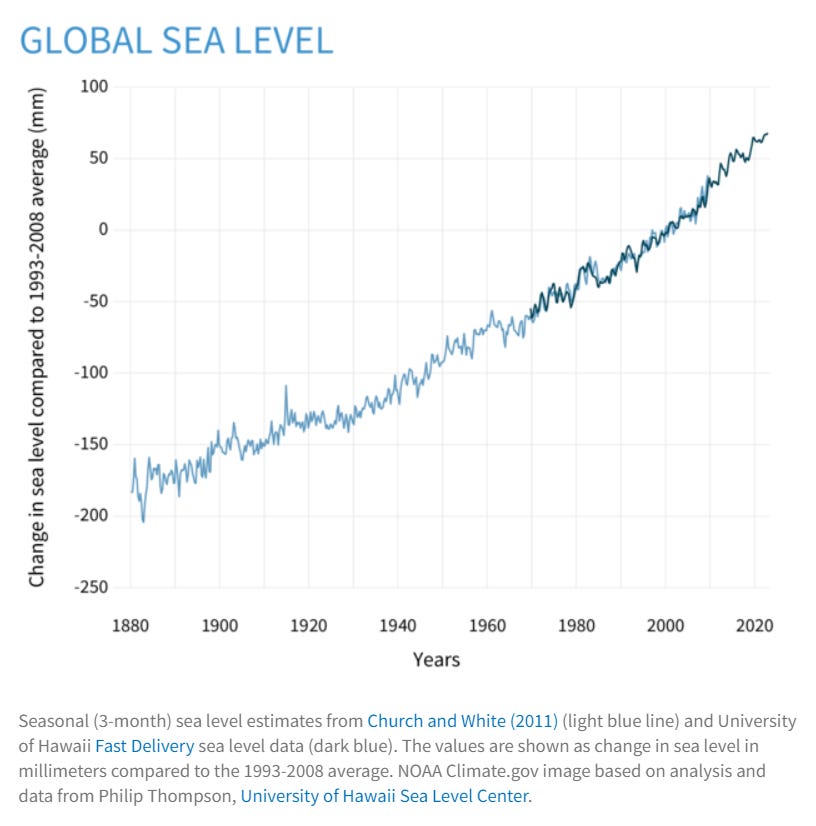
Global sea levels have risen by 8 to 9 inches (21 to 24 cm) since 1880. The melting of the Greenland and Antarctic ice is contributing to even greater increases now. In 2021, the global sea level reached a record high, 3.8 inches (9.7 cm) above 1993 levels. Even with a reduction of greenhouse gas emissions between now and 2100, the sea level is likely to reach 2 feet (0.6 m) higher than in 2000. At the current rate of emissions and warming, sea levels are expected to climb as much as 7.2 feet (2.2 m) higher by 2100. As with all these issues, sea level change will have greater consequence in some places over others, depending on various factors. Eight of the ten biggest cities in the world sit on an oceanic coast. This means a huge number of people will endure greater risks of storm surges, high-tide flooding, and damage to local ecosystems which can have a deleterious effect on food supply or jobs. Additionally, heightened risk caused by rising sea levels will likely lead to reduced or revoked insurance coverage, or higher premiums in those places, putting millions of people at enhanced economic risk or ruin.
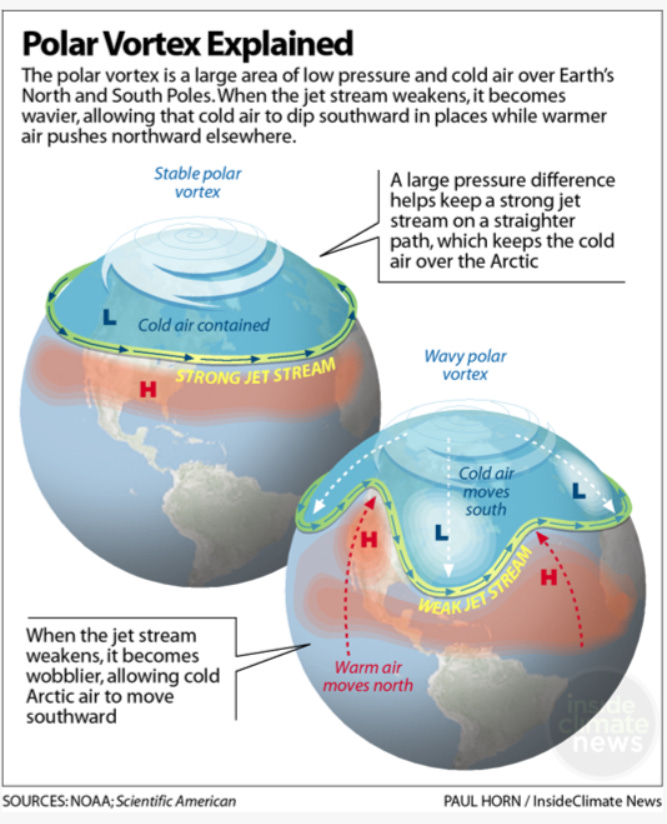
The decline of Arctic and Antarctic ice has many consequences that are already affecting communities across the globe, and will only worsen as the melt rate quickens. The Arctic and Antarctic regions provide a stabilizing effect on the world’s climate. Vast snow and ice covers reflect heat back into space, thereby cooling hotter parts of the globe. As this effect is lessened by diminishing covers, less heat is reflected leading to more intense heatwaves worldwide. The polar jet stream, a high-pressure wind that normally circles the Arctic region, changes its typical track as Arctic temperatures increase. The polar jet stream carries vast amounts of moisture traveling at speeds approaching 300 miles per hour. The path of the jet stream is controlled by the differential of temperatures and atmospheric pressures between the poles and the equator. As the Arctic warms, the differential is reduced causing the jet stream to deviate beyond its usual trajectory. Scientists call this a “Polar Vortex.” As the jet stream creeps away from the poles, warmer air is drawn there while other places experience extreme winters or cold spells.
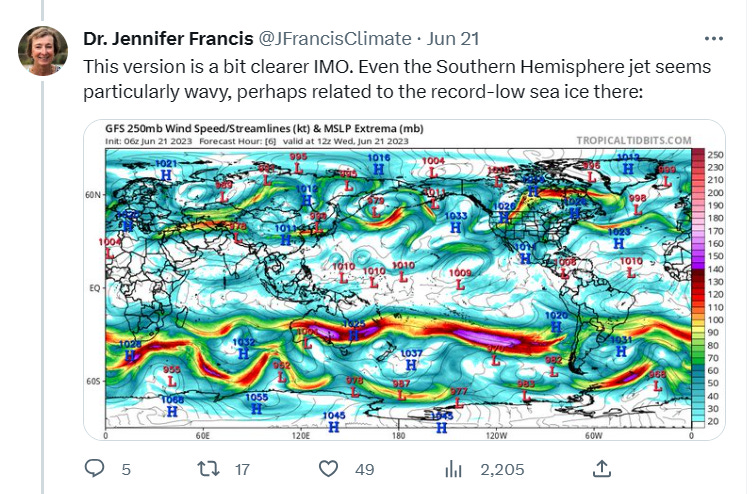
This year, the jet streams both in the north and the south (one accompanies each pole) have become so distorted that some climate scientists are comparing them to a Van Gogh painting. Over North America, the jet stream has broken apart so badly that it has trapped heat in a record-shattering heatwave across a huge portion of the USA’s south and parts of Mexico. Michael E. Mann, who has studied the jet streams for years, called it “such a disjointed configuration.” He stated further, “I'm honestly at a loss to even characterize the current large-scale planetary wave pattern.” Dr. Jennifer Francis noted that the southern jet stream looks especially wavy, “perhaps related to the record-low sea ice there.” From that unusual waviness, many in the Southern Hemisphere are seeing extremely wet weather.
CO2
It has been known for almost 200 years that carbon dioxide (among other gases human activities emit, such as methane) in the atmosphere traps heat, which lends to the warming of the globe. CO2, and other gases, absorb energy at a wavelength that overlaps that of infrared energy. As greenhouse gases absorb infrared energy, the molecules vibrate causing them to re-radiate the energy in all directions, half of which returns to the Earth’s surface. Incoming energy from the sun arrives in the form of light, which these gases do not absorb. Only after the Earth re-radiates that energy does it convert to infrared. So, CO2 cannot repel incoming energy, but it absorbs and re-emits back to Earth half the energy that would normally escape.
Carbon emissions into the atmosphere are indeed a natural phenomenon, but human activity has led to atmospheric concentrations exceeding anytime in the past 3 million years, as far back as the Pliocene Epoch. At that time, sea levels were 50 feet higher than today and forests grew in the Arctic. “Earth was a very different place [then]… You would hardly recognize the land surface, and my gosh, we don’t want to go there,” Rob Jackson, a professor of Earth System Science at Stanford University, told NBC News.
Source: UC San Diego Scripps Institution of Oceanography
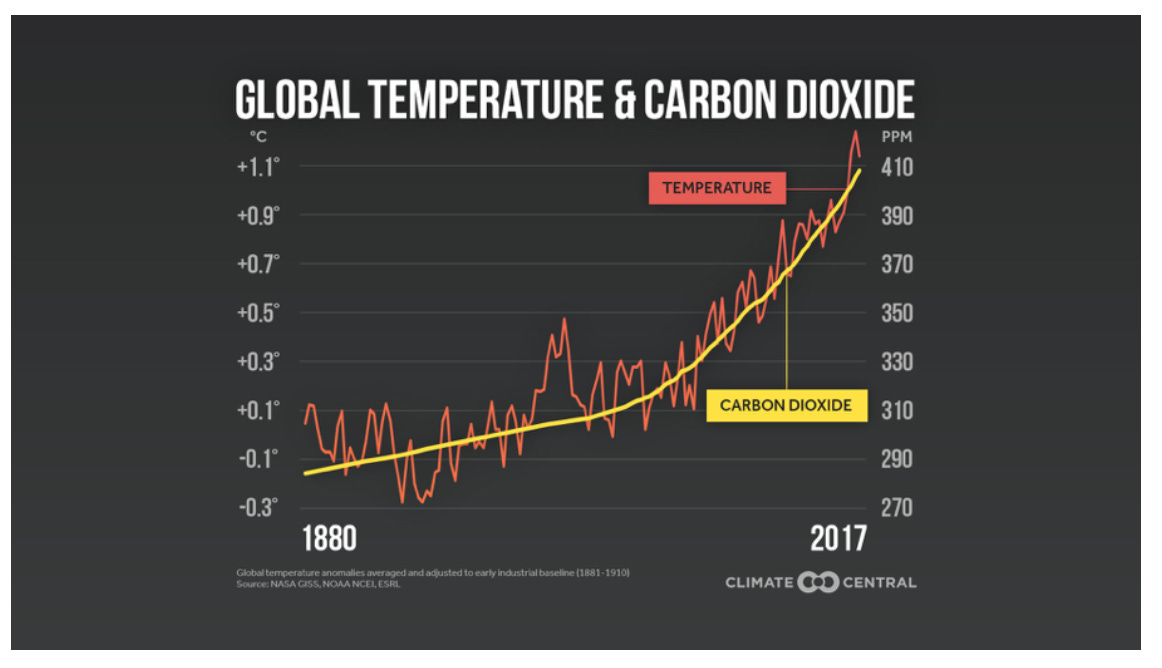
It is well-known what types of activities outside of the natural contribute to carbon dioxide concentrations. Human activities that exude carbon emissions into the atmosphere cause a substantial portion of atmospheric warming. Contrary to what some with political or other agendas say, this is not in dispute by virtually anyone who studies this topic. It is also known that humans engage in a high volume of activities that create these emissions—and these can be pretty specifically quantified. The amount of emitted CO2 can also be directly correlated to global temperature changes. See the following images. The correlation is unmistakable.
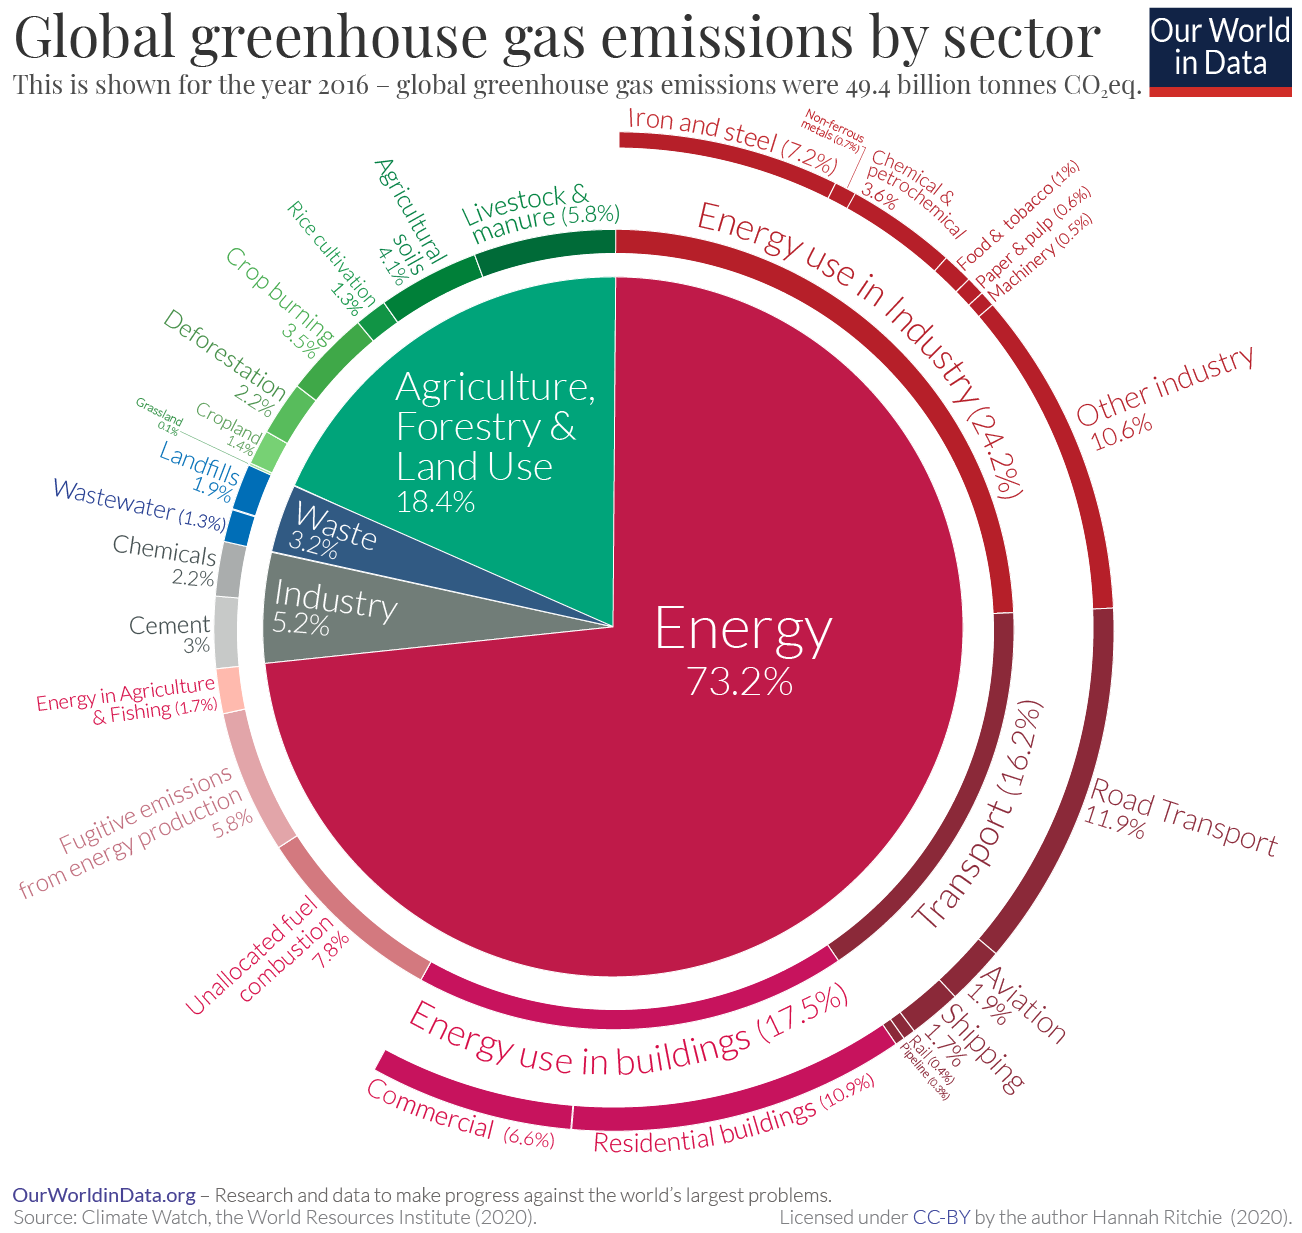
Specific industries account for the vast majority of human-created emissions. For example, energy-related emissions in the iron and steel industries produce 7.2% of overall emissions. Cars and trucks and other road vehicles contribute 16.2%, while the aviation and shipping industries collectively emit 3.6%. Physical structures, such as houses and commercial buildings, are responsible for 17.5%, while agriculture releases 18.4%.
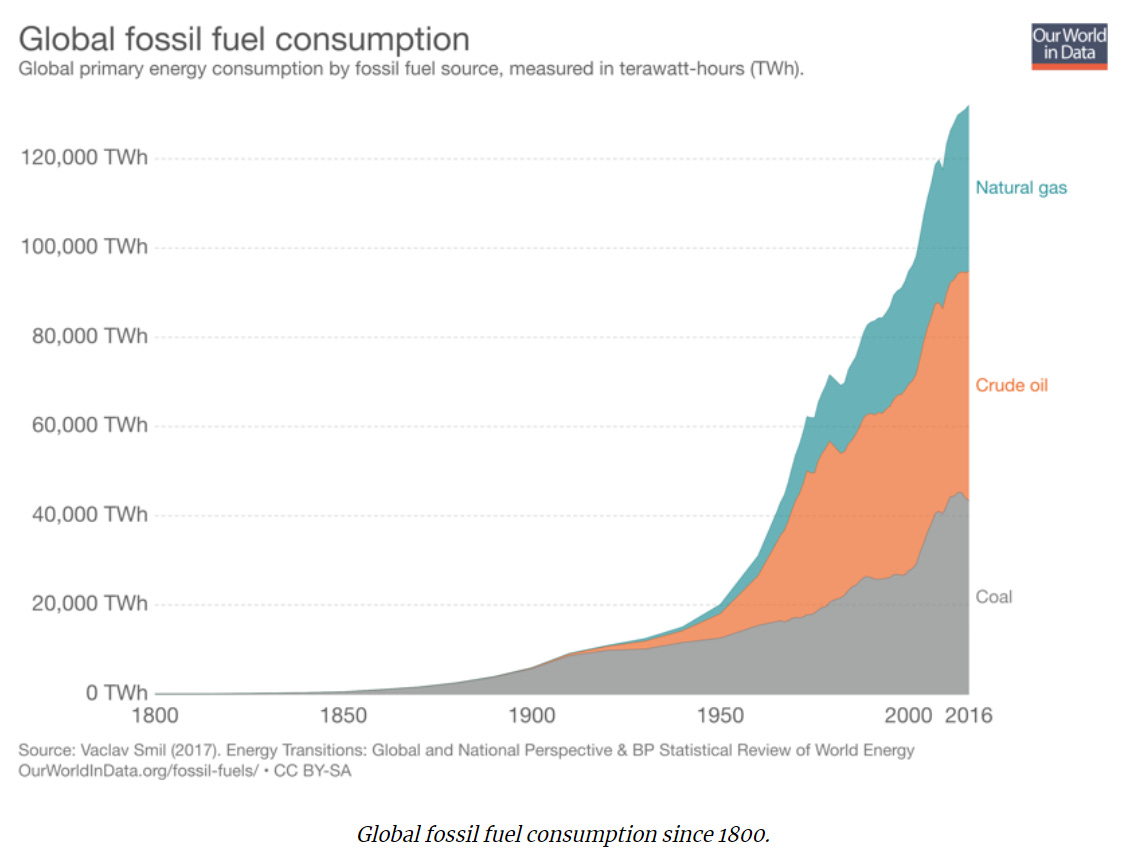
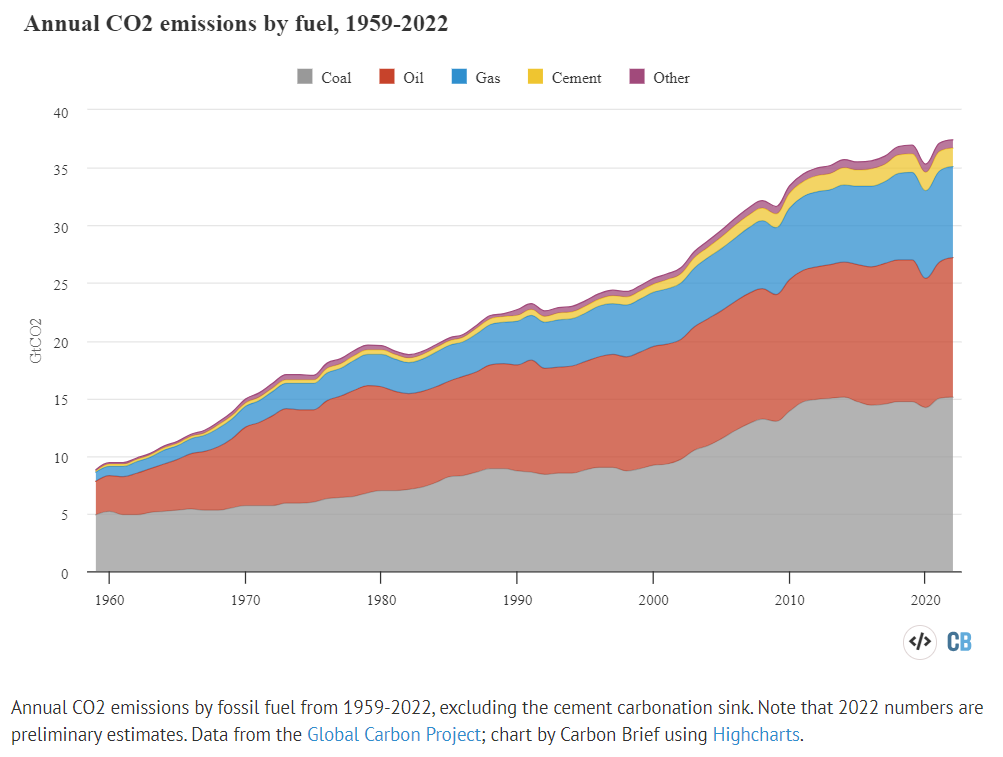
On the whole, though, the fossil fuel industry contributes a total of 73.2% of emissions, as it is involved in many of the sectors identified above (and others not mentioned here). The primary sectors that give rise to these numbers are coal, oil, gas, and cement.
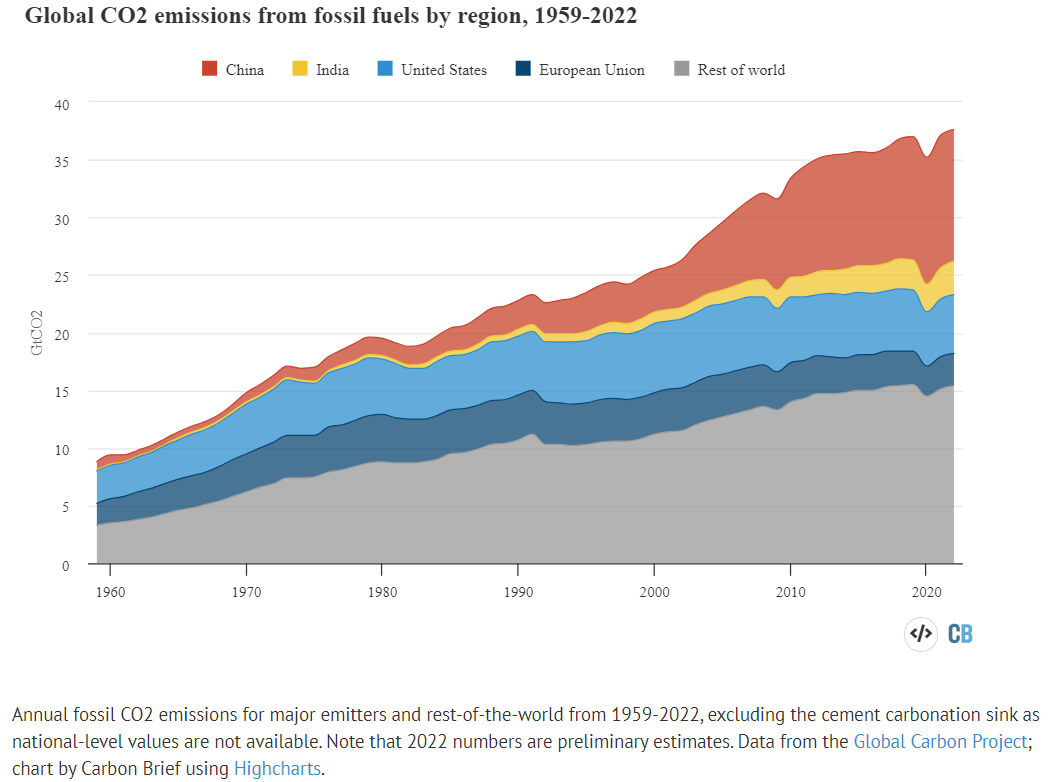
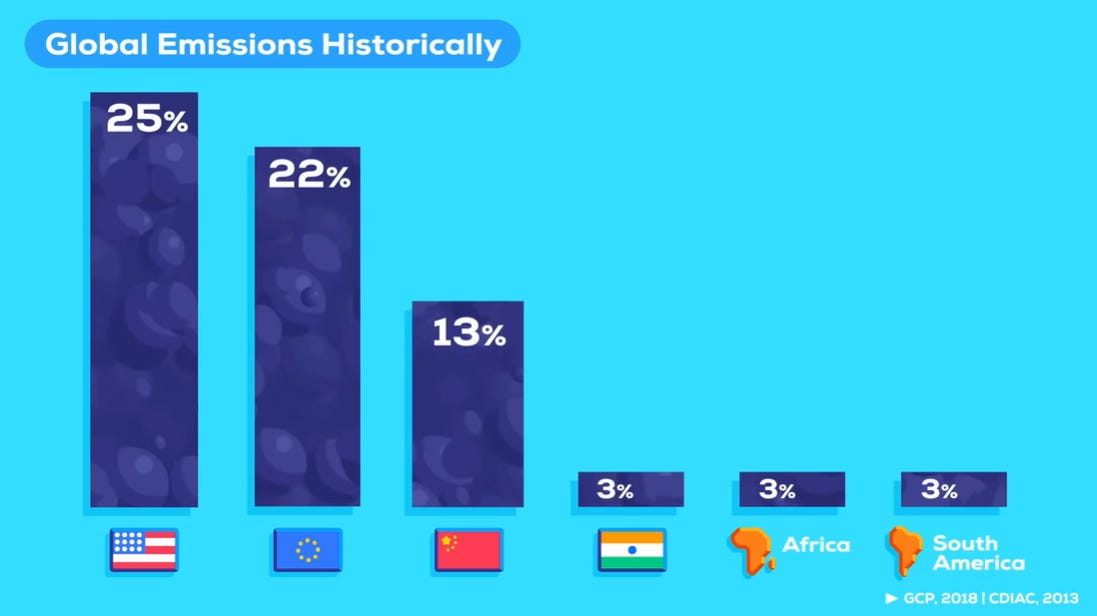
These industries drive the bulk of CO2 emissions and are one of the largest contributors to declines in global health. In 2017, just four geographic areas were responsible for emitting well over half of these kinds of emissions. Those areas include China (27% total contribution), the United States (15%), the European Union (10%), and India (7%). Historically, however, the United States and EU alone are responsible for nearly half of all CO2 emissions since the beginning of the 20th century.
2017 CO2 emissions
Historical Global Emissions
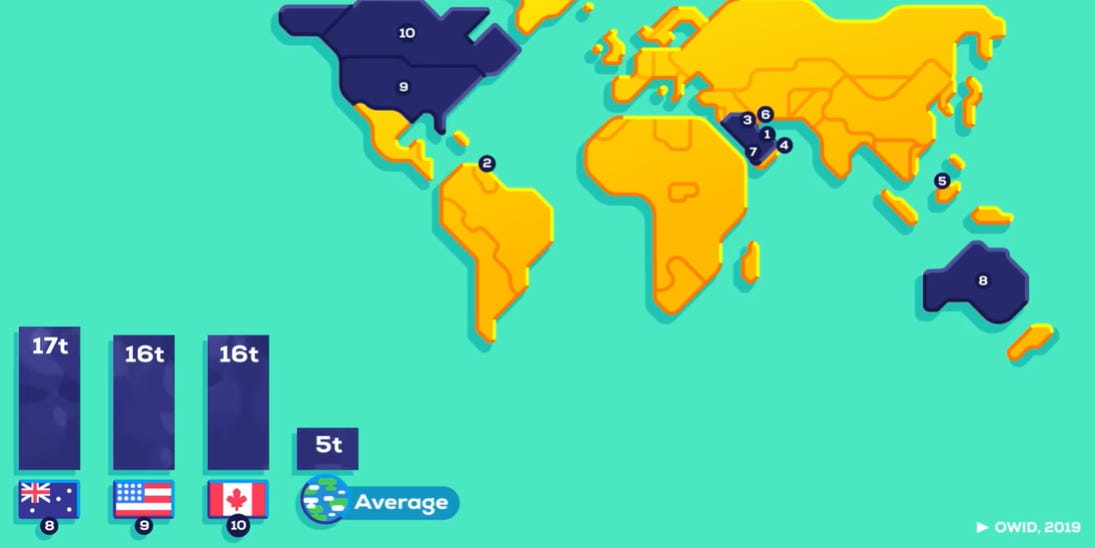
When looking at emissions per capita, Australia, the USA and Canada all exceed the global average by more than 3 times.
Global Emissions per Capita
Researchers measure the content of atmospheric gases many ways. Perhaps the most accurate method, however, is spectroscopy. All atoms and molecules absorb and emit electromagnetic energy at specific wavelengths. Scientists send electromagnetic radiation through a selected portion of the atmosphere and measure how much of that radiation is absorbed and at what wavelengths. This tells them what substances and how much of them are there. To ensure they conduct an unbiased calculation, they collect samples from all over the world, including extremely remote areas that are less influenced by adjacent polluters such as fossil fuel plants or densely packed cities. They then average these amounts to determine overall atmospheric composition. Scientists supplement this data with similar measurements taken from specialized satellites, which can gather evidence samples from much larger geographic areas.
Oceans
The United Nations Climate Action group states that of all ecological zones, the impact climate change has had on oceans is the most severe. A key component of oceanic problems lies with heat. NASA notes that 90% of the warming across the globe is occurring in oceans.
As the oceans warm, water expands causing 1/3 of the rise in sea level globally (exacerbated by global ice melt as discussed above). Warming waters also wreak havoc on ecosystems. In some places, the change is extraordinary. For example, the Sea of Japan saw a 7-degree Fahrenheit increase (4 degrees Celsius) over the norm in 2023. Warming waters drive sea life to different places, sometimes beyond their normal range. This can have an unpredictable effect on food supplies both for marine life and humans. Elevated temperatures lead to coral bleaching. Long term bleaching can be fatal to coral reefs, which provide a staple to a massive number of other marine species. Deaths of coral reefs cause significant disruptions in every link of the food chain. Higher-than-normal ocean temperatures also create more severe weather events, such as hurricanes and cyclones. Studies have shown that the surface temperature of oceans directly correlates to the number and severity of storms that form over them. The other major effect of heightened heat absorption is that it reduces oceanic oxygen levels. Certain species depend on specific ranges of available oxygen—tuna, marlin, and sharks in particular. In some places, the ocean waters have endured a 40% reduction in oxygen levels. This has caused mass fish deaths and poisoning of dozens of mammals from oxygen deficiencies or other associated effects.
Growing levels of CO2 in the atmosphere also have deleterious effects on oceans. Sea water absorbs carbon dioxide naturally, but as concentrations in the air rise, so too do the concentrations of the gas absorbed by the world’s oceans. This leads to higher levels of acidification, which can kill various marine life. Most fish and other sea creatures can withstand increased pH levels for a time, but over longer periods the effect inhibits shell and bone growth, thereby killing them. For other creatures, higher acidification affects their senses, making them more vulnerable to predators, potentially causing an upset to the predator-prey balance. At its current rate, the predicted pH level of the world’s oceans is expected to reach around 7.8. This will be the lowest level since the middle Miocene period, 14 to 17 million years ago (lower pH means higher acidification).
Disasters
Perhaps the most imminent and readily observable evidence of climate change is the rampant growth in severity and frequency of natural disasters. Warmer temperatures provide fuel for tropical storms, hurricanes, and cyclones. One study outlined the increase in rates of intensification in the Atlantic basin between 1982 and 2009. As warmer air can hold more water vapor, storms have the capability of releasing much more intense rainfall. Hurricanes gather strength from warm air, leading to the potential for an increase in the frequency of Category 4 or 5 storms. More powerful storms lead to more prolific storm surges, themselves compounded by already abnormally high sea levels. In many instances, storm surges cause the bulk of the damage to human lives and property.
Rainfalls of strengthening intensity, along with storms and their associate surges, lead to flooding. In Nepal, a region accustomed to enduring annual monsoon rains, rainfall events have changed. Since at least 1986, the overall volume of rainfall in the country has risen by 163 mm per year. But that increase is occurring in the form of more intense rainfall events, with longer dry-spells in between. Decreased ground absorption that occurs during such cycles has contributed to an elevated number of flood events as excess water simply runs off the surface and into existing rivers. These deluges also lead to growing numbers of landslides in hilly and mountainous terrains. Severe rainfall events are occurring more frequently in the higher latitudes, creating flood events in areas where they were previously less or uncommon.
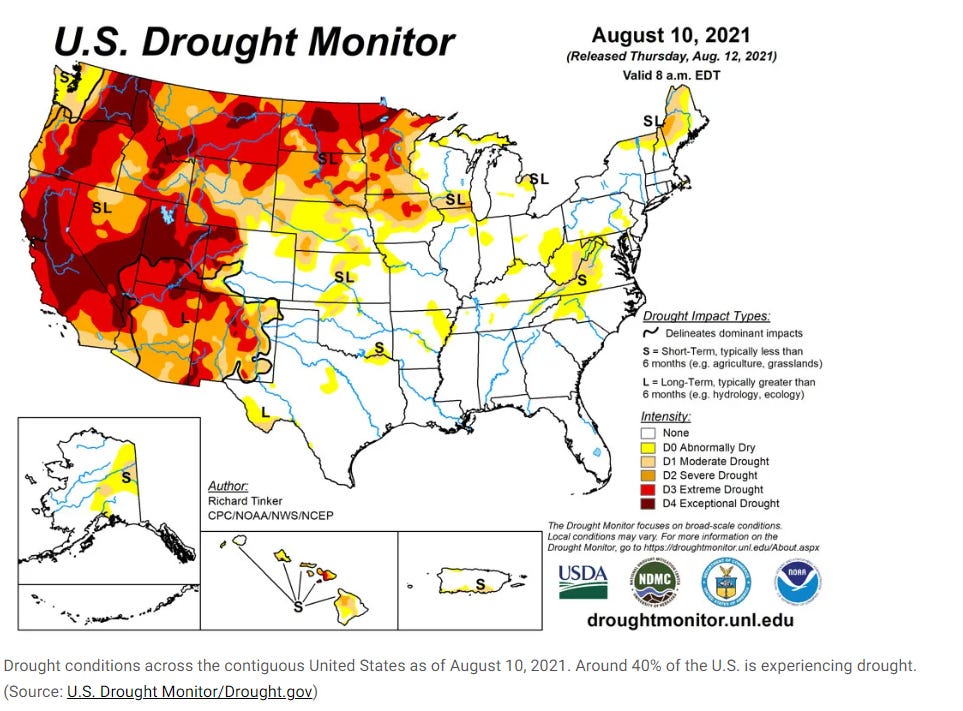
In other places, the complete absence of rain is the growing problem. Because a warmer atmosphere can hold more water vapor, higher temperatures lead to faster evaporation on the surface. Drying surface conditions result in droughts, while the water evaporated into the atmosphere tends to fall in other places at greater intensities, often causing floods there. The American Midwest is among many locales that has seen extreme droughts in recent years as a result of this process.
Warmer temperatures also preclude snowfall, which many areas depend upon for water. Areas with this dependency have seen swiftly climbing numbers of droughts in recent decades, all across the world. While scientists tend to avoid attributing climate change to specific drought events, several studies have shown a strong correlation to some, including the so-called megadrought in the USA. Places enduring long dry-spells or droughts also tend to be more vulnerable to wildfires.
Conclusion
This article explores only a tiny fraction of the overall evidence supporting human-induced climate change. Hundreds, maybe even thousands, of other studies provide further evidence sometimes on a very narrow scale, with others exploring a wide breadth of topics. Nonetheless, while some issues remain in question and require further exploration, there is no question what is happening in total. The roughly 8 billion people on this planet have engaged in practices that are fundamentally changing our ecosphere. The importance is less to find a place to point the finger of blame, and more to start taking proactive steps to mitigate the future damage. With that said, there is consensus about the industries in which the deepest problems lie, and it is also clear that certain entities within these industries have a history of stymieing any effort to curtail their harmful practices. Their bottom line has no place in the discussion of necessary steps moving forward. The world will survive whether humans can live in it or not, but neither the greatest polluters nor the rest of the population can survive another century of activity like the last.
***
I am a Certified Forensic Computer Examiner, Certified Crime Analyst, Certified Fraud Examiner, and Certified Financial Crimes Investigator with a Juris Doctor and a Master’s degree in history. I spent 10 years working in the New York State Division of Criminal Justice as Senior Analyst and Investigator. Today, I teach Cybersecurity, Ethical Hacking, and Digital Forensics at Softwarica College of IT and E-Commerce in Nepal. In addition, I offer training on Financial Crime Prevention and Investigation. I am also Vice President of Digi Technology in Nepal, for which I have also created its sister company in the USA, Digi Technology America, LLC. We provide technology solutions for businesses or individuals, including cybersecurity, all across the globe. I was a firefighter before I joined law enforcement and now I currently run a non-profit that uses mobile applications and other technologies to create Early Alert Systems for natural disasters for people living in remote or poor areas.
Find more about me on Instagram, Facebook, LinkedIn, or Mastodon. Or visit my EALS Global Foundation’s webpage page here.
To read more on the evidence of climate change, check out the following.


